


Portfolio Allocation Experiment
Year 1

It’s been a year since I wrote To Bond or Not To Bond. At the time, I made the case that the risk/reward proposition for an overweight All-US equity portfolio wasn’t very attractive.
To me…it doesn’t seem likely that we’ll be rewarded for holding an overweight U.S. equity portfolio. While equities should continue to outperform bonds for the next ten years, if today’s environment rhymes with history, holding an underweight stock portfolio won’t cost us much in terms of returns. But it may come with the added benefit of lower volatility and overall risk. An underweight portfolio also still has some potential to outperform. That all seems like a good trade-off.
In addition, international (both developed and emerging) markets have relatively enticing valuations and return prospects. While there’s no guarantee that either will outperform U.S. equities, they may offer uncorrelated returns that also won’t drag too much on the overall portfolio.
In general, given the current valuation environment, a balanced portfolio might be the best path forward for risk adjusted returns.
~Me April 24, 2024
You can go back and read the post if you’d like, but the primary point made was that the spread between earnings yields and bond yields is a pretty good indicator for projecting excess long-term returns of stocks over bonds.
I think it would be a fun experiment to track how that projection plays out through time. The spread got worse in the interim, eclipsing -200 basis points at certain points in the last year. Instead of cherry-picking a top, using the post date as a starting point is a good idea since that’s when the signal really first started flashing red to me.
Note: I grappled with even publishing this post in light of recent world events. I don’t want this post to come across as ‘victory lapping’, and it’s definitely too early to declare a winner anyways. I plan on tracking the progress for this experiment for the next decade.
How do we measure success?
First, I don’t think winning or losing is the right mindset. I started writing primarily to learn and test ideas. I won’t be disappointed in the slightest if stocks do happen to scorch bonds from here. In fact, I welcome it. And, rooting for one particular outcome over another could lead to anchoring or just generally inhibiting my ability to evolve my thinking.
My general hypothesis is that stocks won’t “scorch” bonds going forward, and that holding an underweight stock portfolio won’t actually hurt returns to a large degree - something like a 60/40 portfolio will only underperform an all-stock portfolio by about 15%, in aggregate, over the next decade (i.e., if an all-stock portfolio were to grow from 100k to 200k over the next decade, then a 60/40 might grow from 100k to 185k).
I’ll track performance metrics like Sharpe Ratios, but I also don’t think these are end-all, be-all. Someone smarter than me has said “We live in the sample, not the universe”. It’s important to note that just because one particular scenario plays out doesn’t mean that our initial decision (or overall framework) is right or wrong. This applies to all outcomes, even in the case that my hypothesis bears out.
I’ll probably do a post mortem at some point. But, at this time, it’s far to early in the race.
Tracking Portfolios
I think it’s worthwhile tracking 4 portfolios.
100% US Equities (benchmark)
60/40 US Equities & Bonds
Balanced - unhedged
34/33/33 US Equities, Bonds, & Developed International (unhedged)
Balanced - hedged
Same portfolio as (3), but I’ll split the international portion into hedged and unhedged allocations.
The US Equity allocation will use the S&P 500 index (VOO).
I’ll use the Total Bond Market Index (BND) for the bond allocation.
For Developed International, the unhedged allocation will be MSCI EAFE (EFA). The currency hedged portion will be in the corresponding hedged ETF (HEFA).
Adding portfolio 4 is an attempt to build a somewhat currency neutral allocation to international equities. I also have a suspicion that currency movements could offer an additional source of diversification.
Results
Here’s a link to the portfolio results. All past returns data, return metrics like alpha and volatility, and correlation data are from Portfolio Visualizer.
After 1 year, all allocations saw similar levels of returns. US equities obviously had an amazing year in 2024, and are currently being dragged down by tariff news. It’ll be interesting to see how these developments unfold going forward.
Here are the total tallies for a fictional $100k invested in each allocation:
S&P 500: $111,939 (11.9% CAGR)
60/40: $110,606 (10.6% CAGR)
Balanced - unhedged: $111,502 (11.5% CAGR)
Balanced - hedged: $110,558 (10.5% CAGR)
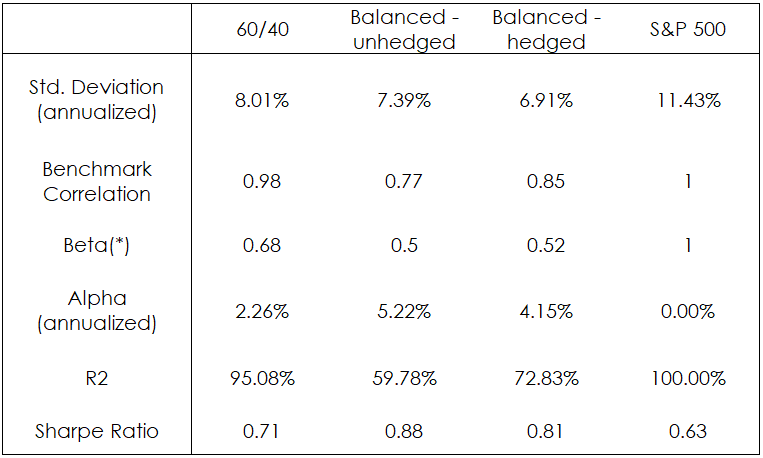
On a risk-adjusted basis, the diversified positions are doing quite well. All of the diversified portfolios, so far, have offered better risk-adjusted returns as measured by both Alpha and Sharpe Ratio metrics.
It’s also worth tracking how these asset classes behave relative to one another. In general, the aim for diversification is to own asset classes that all trend in the positive direction, but don’t move in lock-step with each other. Below is the monthly correlation chart for each asset in the basket.
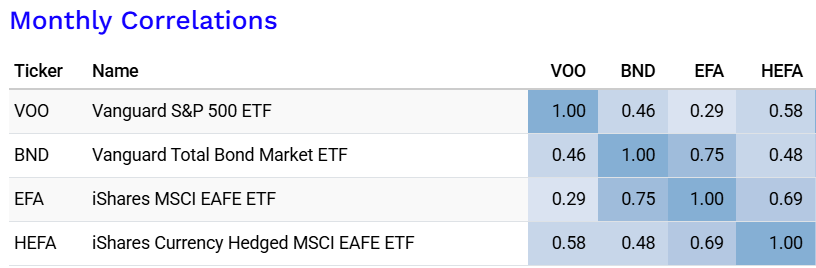
It’s worth noting that we’re finally starting to see bonds detaching from stocks. In 2022, everything was moving in the same direction - stocks and bonds were both falling together. Now that bond yields have started to level off and inflation is generally tamed, they’re starting to move on their own terms.
In addition, international (unhedged) shows very low correlation with domestic equities.
Valuation Metrics - May 2025
At the time of this writing, the Shiller PE ratio stands at 34.5x and the 10-year treasury clocks in at 4.22%.
Stocks & Bonds
This gives an equity-bond spread of -130 basis points (1/34.5 - 4.22%) - much improved from this time last year, but still well inside the worst quartile of historic data. And, while excess returns are expected to be positive for stocks over bonds for the next ten years, they’re not expected to be so high that it’s worth going extremely risk-on (in my opinion). Again, as this experiment hopes to bare out, my hypothesis is that stocks won’t greatly outperform a mixed asset allocation.
Asset Classes
Below is an update to the valuation-growth chart from my original post.

One thing to be aware of is that these growth numbers are coming off of a pretty low base - the 5 year mark started near the lows of 2020. So, these growth numbers could be distorted by quite a bit.
Future Prospects
In these updates, I think it’s worth including commentary on future expectations.
Based on the data, not much has changed in terms of valuations during the past year. International equities still offers better PE ratios than domestic, but with lower growth prospects. Bond yields have fallen from 4.7% (ish) from a year ago - but are still yielding north of 4%. And US equities are still trading at greater than 25x earnings.
In my view, if we were comfortable holding a particular asset allocation during the past year, I see no reason to greatly divert from that at this time. This is irrespective of current geopolitical tensions, of course. You’ll have to make your own assessment on how current events may affect returns.
See you in another year!