

My Buffett Bet
Year 2

In 2008, Warren Buffett famously made a bet that a simple low-cost S&P 500 index fund would outperform a basket of Hedge Funds, after fees. He won that bet.
In similar fashion, in 2024, I made the prediction that a 60/40 portfolio should keep pace with a 100% stock allocation, only slightly underperforming while at the same time, offering better risk adjusted returns.
The end of April marks the two year anniversary of the article that I wrote covering this topic - To Bond or Not To Bond - where I made the case that the risk/reward proposition for an overweight All-US equity portfolio wasn’t very attractive.
To me…it doesn’t seem likely that we’ll be rewarded for holding an overweight U.S. equity portfolio. While equities should continue to outperform bonds for the next ten years, if today’s environment rhymes with history, holding an underweight stock portfolio won’t cost us much in terms of returns. But it may come with the added benefit of lower volatility and overall risk. An underweight portfolio also still has some potential to outperform. That all seems like a good trade-off.
In addition, international (both developed and emerging) markets have relatively enticing valuations and return prospects. While there’s no guarantee that either will outperform U.S. equities, they may offer uncorrelated returns that also won’t drag too much on the overall portfolio.
In general, given the current valuation environment, a balanced portfolio might be the best path forward for risk adjusted returns.
~Me April 24, 2024
Without burying the lede, the results through two years have been about as expected. U.S. stocks have continued to outpace balanced portfolios holding both stocks and bonds. However, the balanced portfolios have offered much better risk adjusted returns.
See here for the year 1 update from last year.
How do we measure success?
My general hypothesis was that stocks won’t “scorch” bonds in the ten year period starting in May 2024, and that holding an underweight stock portfolio won’t actually hurt returns to a large degree - something like a 60/40 portfolio will only underperform an all-stock portfolio by about 15%, in aggregate, over the decade (i.e., if an all-stock portfolio were to grow from 100k to 200k, then a 60/40 might grow from 100k to 185k).
Tracking Portfolios
I think it’s worthwhile tracking 4 portfolios.
100% US Equities1 (benchmark)
60/40 US Equities & Bonds2
Balanced - unhedged
34/33/33 US Equities, Bonds, & Developed International3 (unhedged)
Balanced - hedged
Same portfolio as (3), but I’ll split the international portion into hedged4 and unhedged allocations.
Adding portfolio 4 was an attempt to build a somewhat currency neutral allocation to international equities. I had a hunch that currency movements could offer an additional source of diversification.
Results
Here’s a link to the portfolio results. All past returns data, return metrics like alpha and volatility, and correlation data are from Portfolio Visualizer.
Here are the total tallies for a fictional $100k invested in each allocation:
S&P 500: $146,490 (21.0% CAGR)
60/40: $132,276 (15.0% CAGR)
Balanced - unhedged: $133,548 (15.6% CAGR)
Balanced - hedged: $132,635 (15.2% CAGR)
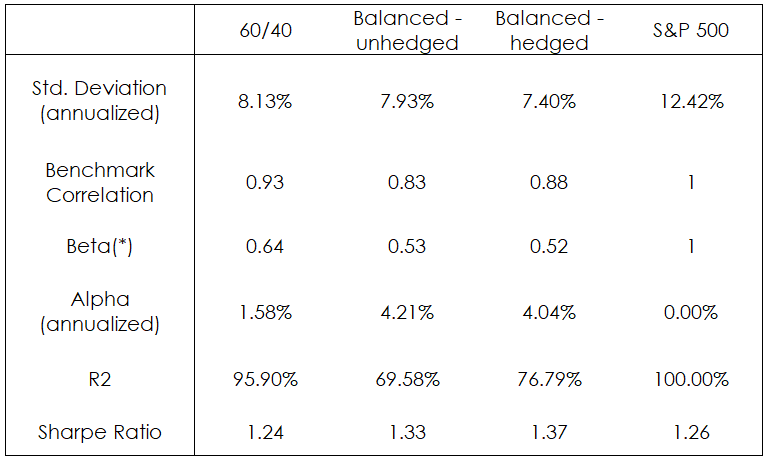
On a risk-adjusted basis, the diversified positions are doing quite well. All of the diversified portfolios, so far, have offered better risk-adjusted returns as measured by both Alpha and Sharpe Ratio metrics.
It’s also worth tracking how these asset classes behave relative to one another. In general, the aim for diversification is to own asset classes that all trend in the positive direction, but don’t move in lock-step with each other. Below is the monthly correlation chart for each asset in the basket.
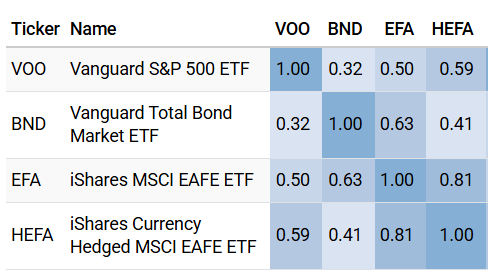
Bonds continue to show low (but positive) correlation with the S&P 500 index. The unhedged developed international fund’s correlation with the S&P 500 increased from last year. Overall, this is about what one would hope for when investing in other asset classes - low correlations between holdings.
Valuation Metrics - May 2026
At the time of this writing, the Shiller PE ratio now sits above 41x and the 10-year treasury clocks in at 4.39%.
Stocks & Bonds
The “straight up” equity-bond spread is -195 basis points (1/41 - 4.39%) - which has worsened since this time last year, and sits well inside the worst quartile of historic data.
I’ve since updated my CAPE spread methodology. The updated chart can be found below.
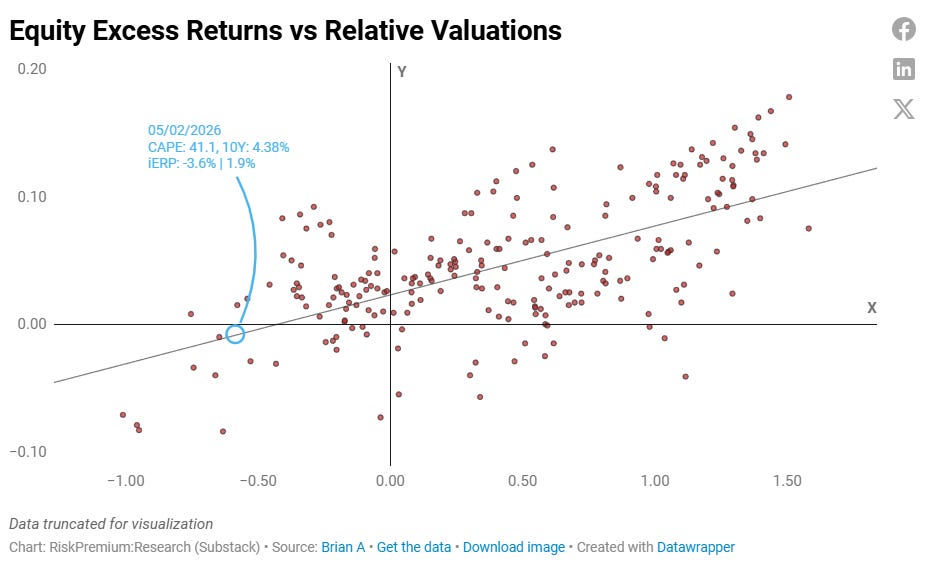
We’re now entering the territory where expected returns for stocks have a strong likelihood of underperforming bonds over the next decade.
Asset Classes
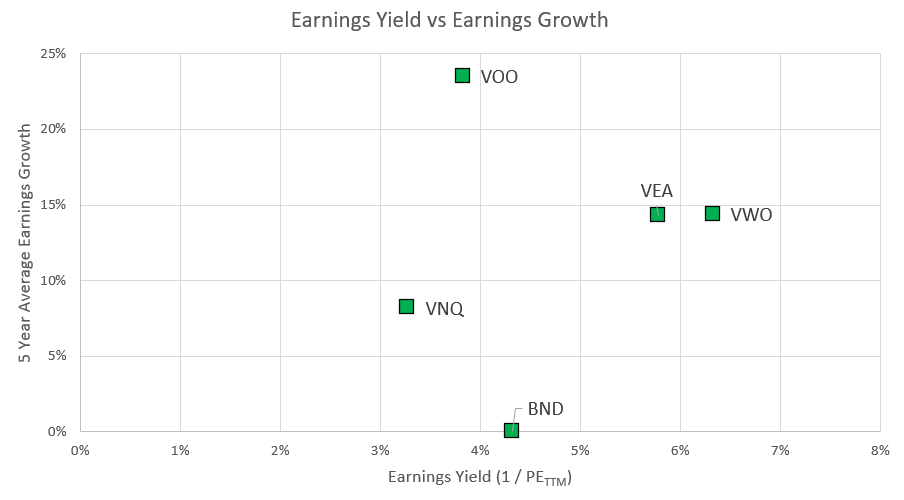
Below is an update to the valuation-growth chart from my original post.
Future Prospects
Valuation levels continue to creep up via PE expansion for basically all asset classes. International equities still offer better valuation entry points on a raw price-to-earnings basis, but are still maintaining lower earnings growth rates.
Here’s the thing about valuations. If S&P 500 companies can maintain 20%+ earnings growth rates for the next handful of years (and beyond), there really is no valuation level that can’t be justified. A 30x TTM multiple becomes a 15x multiple pretty quickly at those levels of growth rates. The question becomes “how sustainable is this?”
Nothing in the data says to bail on US domestic equities. Lower valuations and higher growth is a fine recipe for continued success. That said, history indicates that equity risk premiums are razor thin right now (as they have been for the last 2 years). And I think that I can show that the risk of a lost decade5 is ever increasing as valuation spreads continue to tighten.
We’re now starting to enter bubble territory, in my opinion. The AI revolution is very real, and I am benefiting immensely from it. The rate that I am able to iterate through ideas and research continues to surprise even myself. But as we see hardware stock prices turning parabolic, I begin to wonder if we’re betting on cyclical businesses at peak earnings. Half of Google’s latest quarterly earnings were captured in the form of unrealized gains on investments - something that has the potential to inflate earnings at the index level. Nvidia continues to take operating cash flows, invest them into “partners” (read “customers”), who then use the funds to purchase Nvidia chips - completing the circle where Nvidia basically turns earnings into revenue. This isn’t a bad thing, necessarily, as the real transaction is essentially chips for equity. But as a “picks and shovels” play in the space, their future is certainly tied pretty tightly to the success of their partners “striking gold”. Nvidia is at risk of future write-downs on these investments.
In addition, it’s unclear who the winner is going to be in the AI arms race…if there will be one at all. Just because a service creates immense value (and AI, without a doubt, creates immense value) doesn’t mean that value will be captured by corporations. Airlines create immense value, and they are terrible businesses to invest in.
Timing this thing has always been the question - the skepticisms that I’m raising now have long been a concern. But I think we’re getting to a point where we might be able to see where the line ends on this runaway train. But I don’t think we’re quite there yet.
I continue to believe that diversification is going to be the winning strategy, here. I’m perfectly fine with the notion of dancing while the music is playing, and I don’t think that the band is done yet. But it seems like now is the time we want to be modestly cautious. Incredible investing opportunities don’t start from historic valuations.
See you in another year!
ETF: VOO
ETF: BND
ETF: EFA
ETF: HEFA
I define a lost decade as a period where stocks underperform bonds - I will show the methodology and results of this study at a later date.
60/40 is priced for balance. The variable is what happens if imbalance persists.