


Should the Risk Premium Exist?
A critique on Howard Marks' take on risk

Howard Marks explains the risk premium as the result of widening ranges of potential outcomes as you move along the risk spectrum. See Figure 1.
On the surface this seems reasonable, but on closer inspection, I don’t find this to hold much water.

Think about what this chart is portraying. If this chart represents the true distribution of outcomes, then taking more risk offers guaranteed higher returns - On Average. Sure, not for every security you select, or a single asset class, or even the total market for any given period. But, for every security, through the fullness of time, these excess returns are essentially guaranteed.
Put another way, if a venture capital investor buys a basket of startups and expects a 20% CAGR, why aren’t other funds bidding up the price of that basket?
Can it all be explained away by volatility?
For those that are volatility agnostic, the risk premium is a source of arbitrage.
Volatility matters. The psychology of market swings can be tough to stomach, and not everyone has infinite investment horizons.
But, there exists a wide swath of investors that aren’t held captive by these limitations. Endowment funds have investing horizons of basically forever. A typical 25 year old, who’s future career earnings shadow their current net worth, is also agnostic to volatility.
Investors are beholden by their ability to ante up.
If an investor goes all-in on a single risk asset and gets it it wrong, their portfolio blows up, and they no longer have the funds to get back in. It’s the same reason we don’t play Russian Roulette - if you lose, you can’t play again.
The role of diversification fixes this, in theory. In a perfect world you could select uncorrelated investments, and as long as you own many assets that fall along the full distribution, this remains a free source of arbitrage and you can go as risky as you want. Unfortunately, in the real world, correlations can often converge to one in an economic meltdown, impairing your ability to “ante up” again.
So we probably do want some positioning that is on the safer side. You could hold cash (“dry powder”), but you don’t have to be in cash to capture this effect. You just need to be in assets that are more resilient and won’t go to zero.
The Capital Allocation Line’s (CAL) natural state should be much flatter.
Going back to Figure 1, over time the source of arbitrage of simply taking more risk for higher expected returns should trend towards zero. Sure, maybe we shouldn’t expect risky assets to only yield 4.5% today. It makes sense that they would yield more - perhaps similar to the term premium for bond yields of varying duration. Since risky assets are more volatile and have a wider dispersion of outcomes, investors require a longer time horizon and stronger mental fortitude to actually see it through. It makes sense that there is some premium for that? But does it make sense that that premium would be 5-7%? I don’t think so.
Changing CAL can affect returns
I’ve covered how risk changing can affect asset pricing in the past (my letter is called Risk Premium, after all).
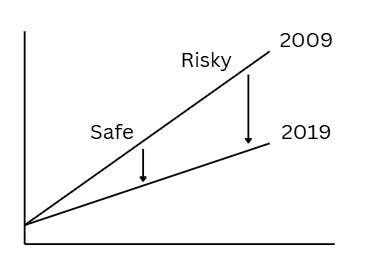
When the CAL falls (as shown in Figure 2), this will often manifest as rising PE ratios. This corresponds to the time period between 2009 and today. This phenomenon can also occur very rapidly like we saw in the eighteen months following the Covid crash.
I think this phenomenon is natural and justified - the CAL should trend towards flatness. Large crashes, like the 2008 period declines, are probably an overreaction (easy to say in hindsight).
Fun Fact! Did you know that Microsoft’s PE ratio was 10x in 2010. Today it stands at 35x. The falling risk premium accounts for 8% of it’s annualized per share growth over the past 15 years. Why didn’t we all just buy Microsoft?
Note, there’s several ways for the CAL to move. It can translate up or down, where the entire CAL shifts (including the risk free rate). It can rotate (like above). Or some combination of the two.
Behavior of returns when the CAL moves.
When the Capital Allocation Line moves, the further out on the capital market line, the more a “risk point” moves. This means that riskier assets outperform to an even greater degree than safer assets.
If you’re wondering why low growth value stocks underperformed growth by such a large degree over the past decade plus, it’s most likely that as risk appetites rose, risk assets were bid up considerably more than safe assets.
Taking this all the way to the safest asset, bonds didn’t give investors any returns above or below their starting yields (expected returns) for the decade proceeding the GFC simply because that point didn’t move at all over that time period (shown in Figure 3).
But that brings us back to our initial question:
Should the risk premium even exist?
Honestly, I don’t think it should. It makes a lot of sense, to me, that risk assets are bid up over time to the point where expected returns approach the risk free rate. Naturally, there should be some expected return above the risk free rate - whether we call it a term premium or a conservative bias premium (where buyers will want to pay less for risk assets simply because they’re less confident in how to value those assets).
Now that we look back at 2009, I don’t think it is unreasonable to conclude that the actual risk premium was near 10%. The Shiller PE bottomed under 15 in 2009. This gives a 7% earnings yield. Tack on a few percent for growth, and expected returns probably were reasonably 10% or more. This, while treasuries we’re yielding 1%. That’s basically the definition of arbitrage.
That spread between earnings yields and bond yields led me to invest my entire stack in March of 2020 when the Shiller PE hit a low of 20x (conservative 4% earnings yield) while treasuries dropped to 0.5%. Here’s an excerpt from a note I made at the time:
I could realistically see equities gaining close to 50% in the coming few years as the added equity risk premium due to covid slowly peels away. (If the risk free rate remains low, then a falling equity risk premium leads to higher asset prices.)
~Me - April 12th, 2020
With hindsight, this effect happened faster and to an even greater degree than I had anticipated.
Where are we today?
For the same reasons, I hesitate to go out on a limb, today, because while that spread was 600 bp in 2009 and 350 bp in 2020 (both landing at, or near, the best historical quartile of the past century), it stands at -190 bp today (worst historical quartile). This doesn’t make markets overvalued, per se, but it certainly indicates that there’s presently very little arbitrage opportunity.
I’ve previously shown that this spread correlates well with future excess returns, and I think is a good heuristic for judging the risk premium.
To Bond or Not To Bond

Primary Takeaways:
1) stocks outperform bonds almost always and
2) there is a decent correlation between the equity-bond spread and excess returns.
When stocks yield much higher than bonds, stock heavy portfolios tend to do better, in comparison, vs when the spread is low or negative.
Note that this is not a call to action to bail on US equities. The problems of valuation and expected returns are multidimensional, and risk is only one variable. Future earnings are just as important and even harder to forecast. But, in the same breath, I also don’t hesitate to say that today’s environment does not emulate a “Fat Pitch”.